
Friday Open Thread [3.7.14]

The Congressional Budget Office (CBO) has an update of the costs and savings of Obamacare, otherwise known as the Patient Protection and Affordable Care Act. As you can see in the chart above, costs are lower than the CBO originally estimated. Meanwhile, as more and more people get insurance under the provisions of the Act, and the more time passes without people’s FREEDOMS and LIVES being taken away like Sarah Palin said they would, the more people support the Act. In fact, the polling is already showing it. And that means doom for the Republican campaign theme of 2014.
Support for candidates who voted for the health-care law has improved dramatically in recent months, a Washington Post/ABC News poll released Tuesday shows. The survey found respondents almost exactly split on the question of whether they would be more or less likely to vote for a congressional candidate who supports the Affordable Care Act, with 34% saying they would be more likely to vote for the candidate and 36% saying they would be less likely to do so. Some 27% said it would not make a difference.
In November, during the troubled launch of HealthCare.gov, just 21% said a candidate’s support for the law would make them more likely to vote for them, compared to 37% who said it would make them less likely to do so. A much larger percentage—40%—were indifferent. The hardcore 36-37% opposed to the law and thus opposed to anyone who says anything good about the law stayed basically the same, with all change come from those who were indifferent, who now love the law enough to say it will make it more likely that they will support a candidate who supports Obamacare. That is a 14 point net swing. That is huge for only four months. Imagine where we might be in another, or July….
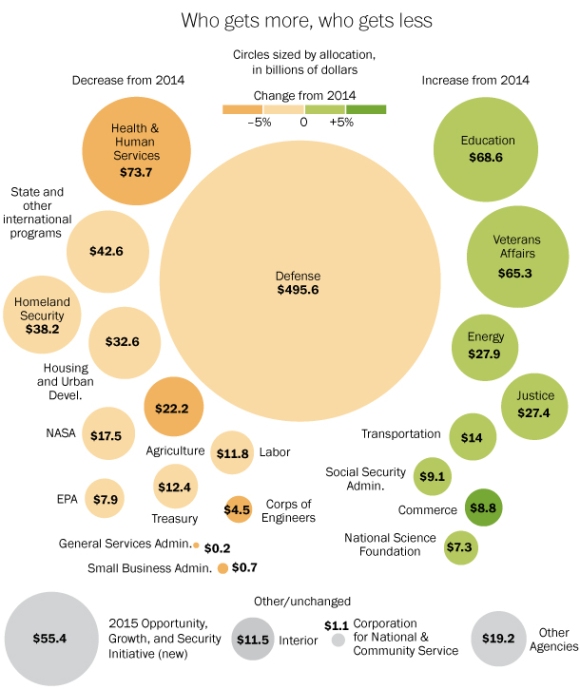
President Obama’s budget
From the Monkey Cage:
“In Ideology in America, Christopher Ellis and James Stimson describe a striking disjuncture. When identifying themselves in a word, Americans choose ‘conservative’ far more than ‘liberal.’ In fact they have done so for 70 years, and increasingly so since the early 1960s.”
“But when it comes to saying what the government should actually do, the public appears more liberal than conservative. Ellis and Stimson gathered 7,000 survey questions dating back to 1956 that asked some variant of whether the government should do more, less, or the same in lots of different policy areas. On average, liberal responses were more common than conservative responses. This has been true in nearly every year since 1956, even as the relative liberalism of the public has trended up and down.”
Russians as war weary as Americans when it comes to going to war with the Ukraine:
The Kremlin’s own pollster released a survey on Monday that showed 73% of Russians reject it. In phrasing its question posed in early February to 1600 respondents across the country, the state-funded sociologists at WCIOM were clearly trying to get as much support for the intervention as possible: “Should Russia react to the overthrow of the legally elected authorities in Ukraine?” they asked. Only 15% said yes – hardly a national consensus.

This is really interesting — A Conservative’s Case Against the Death Penalty. By A Kentucky state senator, David Floyd.
Banks never learn: http://homes.yahoo.com/news/how-to-get-a-home-with-3-5-percent-down-221617126.html